We analyzed how healthcare organizations use email marketing in the first quarter of 2024, looking for trends and insights so we can bring you the latest statistics, send patterns, and benchmarks.
Our Q1 analysis delves into our largest dataset so far, analyzing 17,755,870 emails sent by 128 healthcare organizations over Q4 2023 and Q1 2024.
This report highlights engagement metrics, contrasting drip and marketing emails, and reveals seasonality and day-of-the-week dynamics that could influence overall performance.
Snapshot:
- Dataset: 17.75 million emails sent between October 1, 2023, and March 31, 2024.
- Contributors: 128 unique healthcare industry senders.
- Focus: Engagement statistics, drip campaign vs. marketing email effectiveness, and industry send frequency.
Q1 email marketing benchmarks
Use these below stats to guage how your emails are performing relative to other healthcare marketing email campaigns.
| Email Type | View Rate | Click-through Rate | Bounce Rate | Unsubscribe Rate |
|---|---|---|---|---|
| Drip Email | 56.36% | 5.36% | 2.50% | 0.25% |
| Marketing Email | 36.23% | 1.98% | 3.44% | 0.06% |
Q1 2024 email marketing stats
- The average view rate was approximately 36%.
- The average click-through rate for marketing emails was approximately 2%. This rate is the percentage of views that resulted in clicks.
- The average unsubscribe rate was 0.06%, indicating that a tiny percentage of every delivered email resulted in recipients unsubscribing.
- Healthcare marketers sent an average of 7 emails to customers each month.
- Saturday had the highest view rate (49%) and CTR (5%) for both marketing and drip campaigns.
View rate trends
We see a general upward trend in Q1, but with some volatility, as the rate in March remains higher than January but shows a slight decline from February, suggesting a leveling trend as we approach Q2.
- January 2024: The view rate was 34.77%.
- February 2024: The view rate increased to 37.48% - a 7.79% increase from January.
- March 2024: The view rate slightly decreased to 36.98% - a 1.33% decrease from February.
Comparing marketing emails to drip campaigns
Drip campaigns had a significantly higher view rate compared to regular marketing email campaigns and were more effective in engaging recipients. This is likely due to higher patient relevance and timing.
- Drip Email Campaigns: The average view rate was 56.36%.
- Marketing Email Campaigns: The average view rate was 36.23%
Similar to the view rates, drip campaigns also exhibit a higher click-through rate compared to regular marketing email campaigns.
- Drip Email Campaigns: The average CTR was 5.36%.
- Marketing Email Campaigns: The average CTR was 1.98%.
Marketing email performance by day
Email campaigns perform differently throughout the week, with the highest view and click-through rates occurring on weekends, particularly on Saturdays. Bounce rates are highest on Fridays, while unsubscribe rates remain consistently low throughout the week.
| Day of the Week | View Rate | Click-through Rate | Bounce Rate | Unsubscribe Rate |
|---|---|---|---|---|
| Monday | 34.65% | 1.69% | 1.89% | 0.05% |
| Tuesday | 33.11% | 2.04% | 3.34% | 0.06% |
| Wednesday | 34.10% | 2.48% | 3.23% | 0.06% |
| Thursday | 38.76% | 1.98% | 3.39% | 0.07% |
| Friday | 42.68% | 1.71% | 5.19% | 0.08% |
| Saturday | 49.93% | 4.75% | 2.24% | 0.05% |
| Sunday | 38.33% | 2.14% | 1.46% | 0.07% |
Did list size impact engagement?
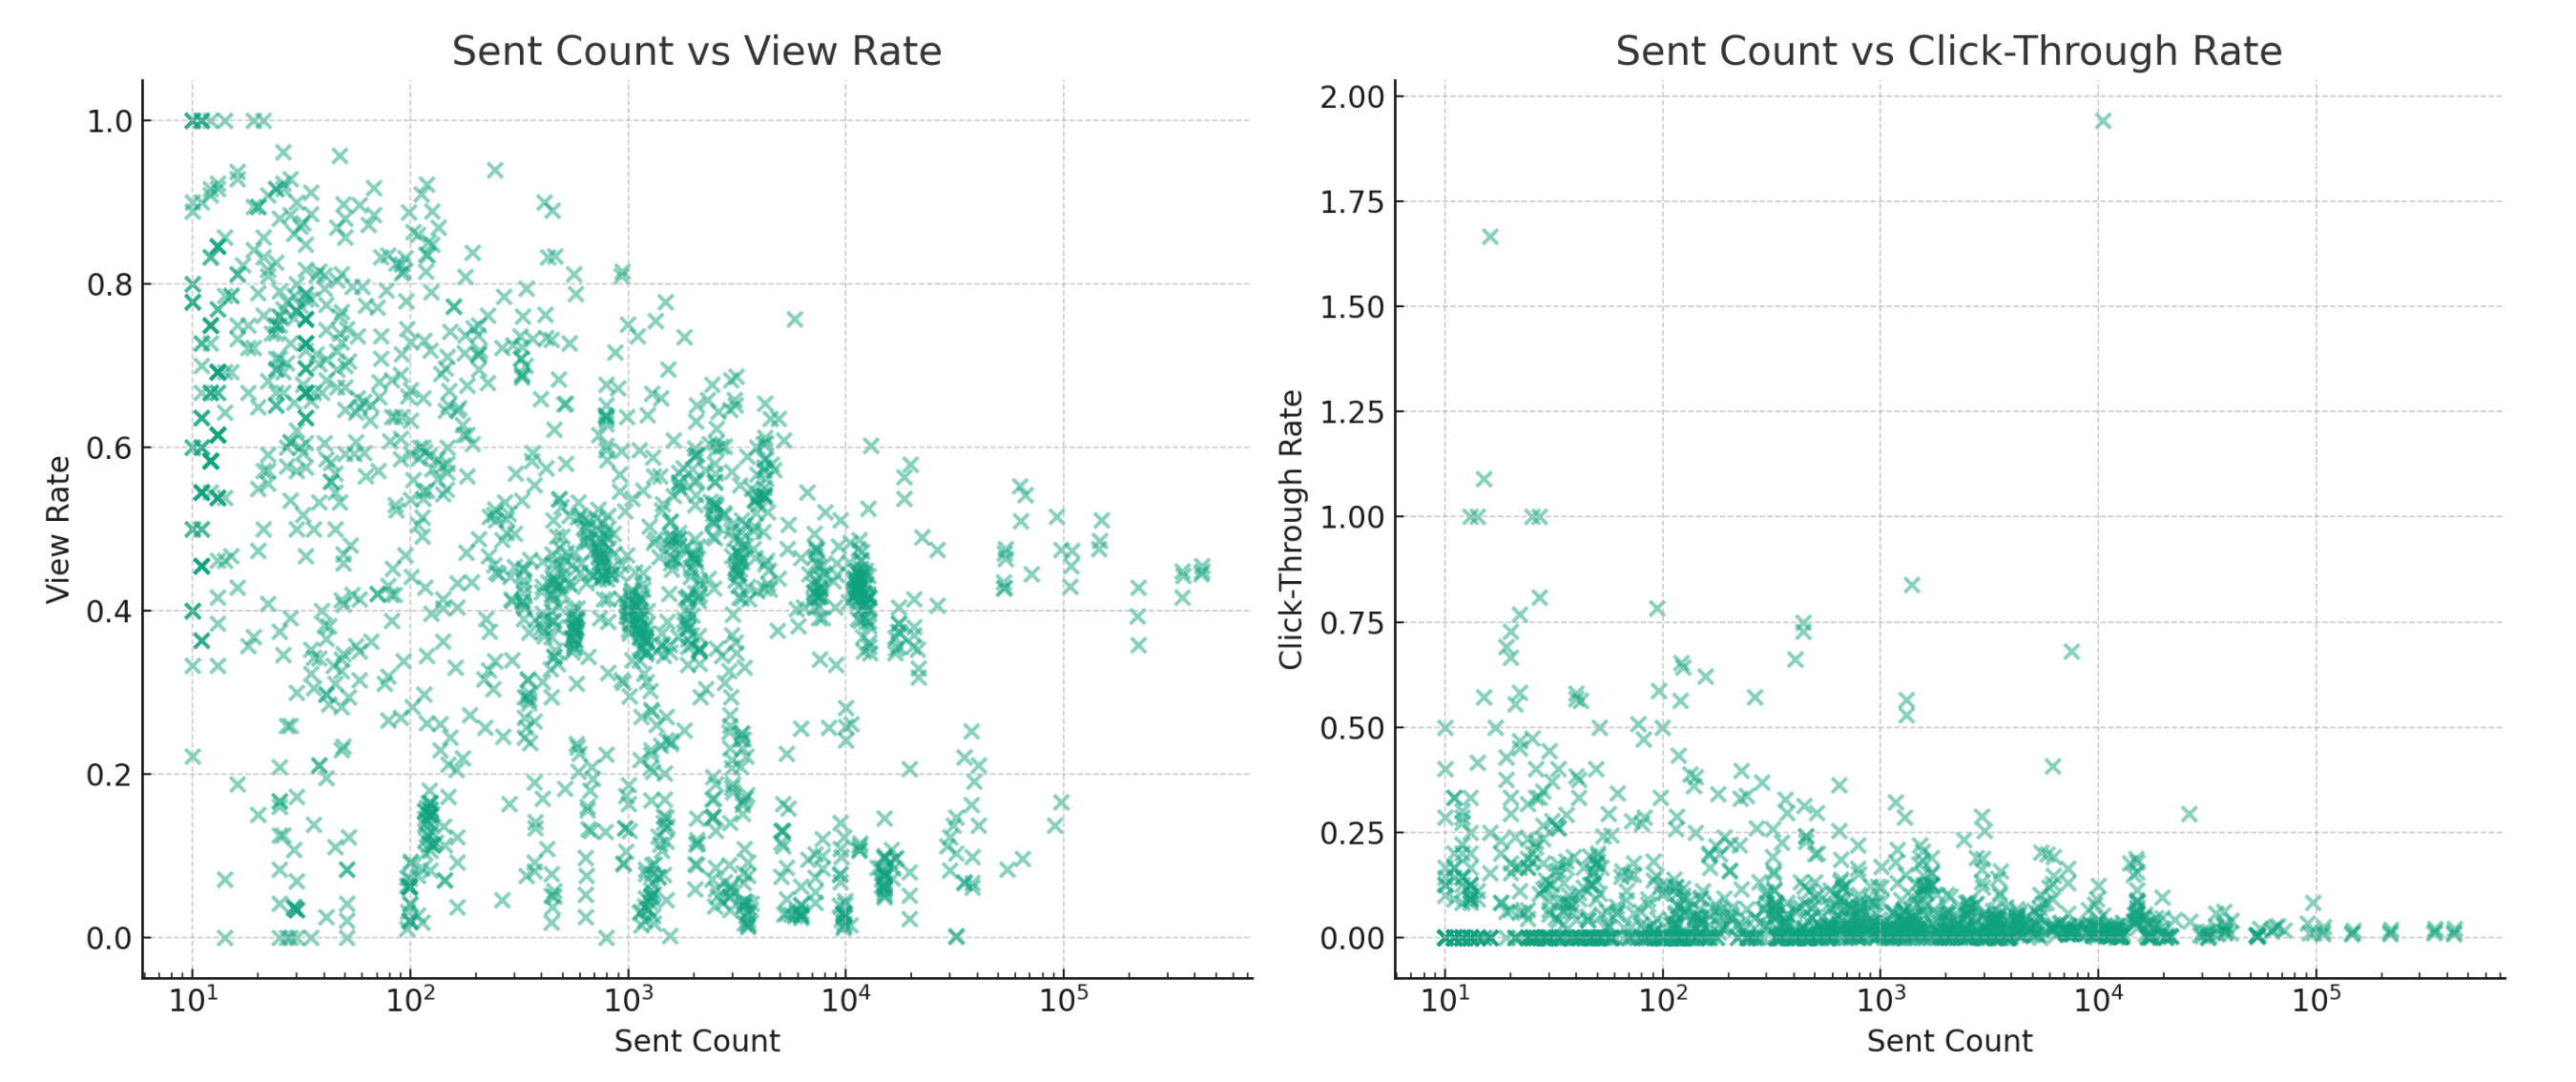
No. Based on our analysis, list size did not affect engagement.

- Sent Count vs View Rate: The scatter plot shows no clear relationship between the number of recipients and the view rate, indicating that larger sends don't necessarily result in proportionally higher or lower view rates. The view rate seems somewhat independent of send size.
- Sent Count vs Click-Through Rate: Similarly, the scatter plot reveals that the click-through rate does not display a consistent trend with increasing send counts. Most data points suggest that the click-through rate remains low across varying send sizes, with only a few outliers achieving higher rates at smaller send counts.
Do marketing emails have to be HIPAA compliant?
Under HIPAA, marketing is defined as communication about a product or service that encourages recipients to purchase or use the product or service. So email communication, including email marketing, must adhere to HIPAA compliance when used by covered entities or their business associates.
Note: According to the U.S. Department of Health & Human Services, if the marketing involves protected health information (PHI), it generally requires an individual's authorization. This is especially relevant for email marketing, where PHI might be used to target or tailor messages. Therefore, for email marketing to be HIPAA compliant:
- Obtain authorization: Before sending marketing emails that involve PHI, covered entities must secure clear and specific authorization from the individual. This authorization should outline what information is being used, the purpose, and the parties involved in the marketing activity.
- Limit PHI exposure: When using PHI in email marketing, use only the information required for that specific campaign.
- Ensure secure transmission: Email marketing containing PHI should be transmitted securely, employing encryption and other security measures to prevent unauthorized access.
- Business associate agreements (BAAs): A BAA must be in place if a third-party email marketing service is used. Most email marketing platforms won't sign one, so covered entities must use a service, like Paubox Marketing, that will sign a BAA and understand HIPAA regulations.
- Separation of healthcare and marketing content: Care should be taken to distinguish between healthcare-related communications (which are generally not considered marketing) and actual marketing communications.
Go deeper: What are the opt in exceptions?
Subscribe to Paubox Weekly
Every Friday we'll bring you the most important news from Paubox. Our aim is to make you smarter, faster.

 Dean Levitt

